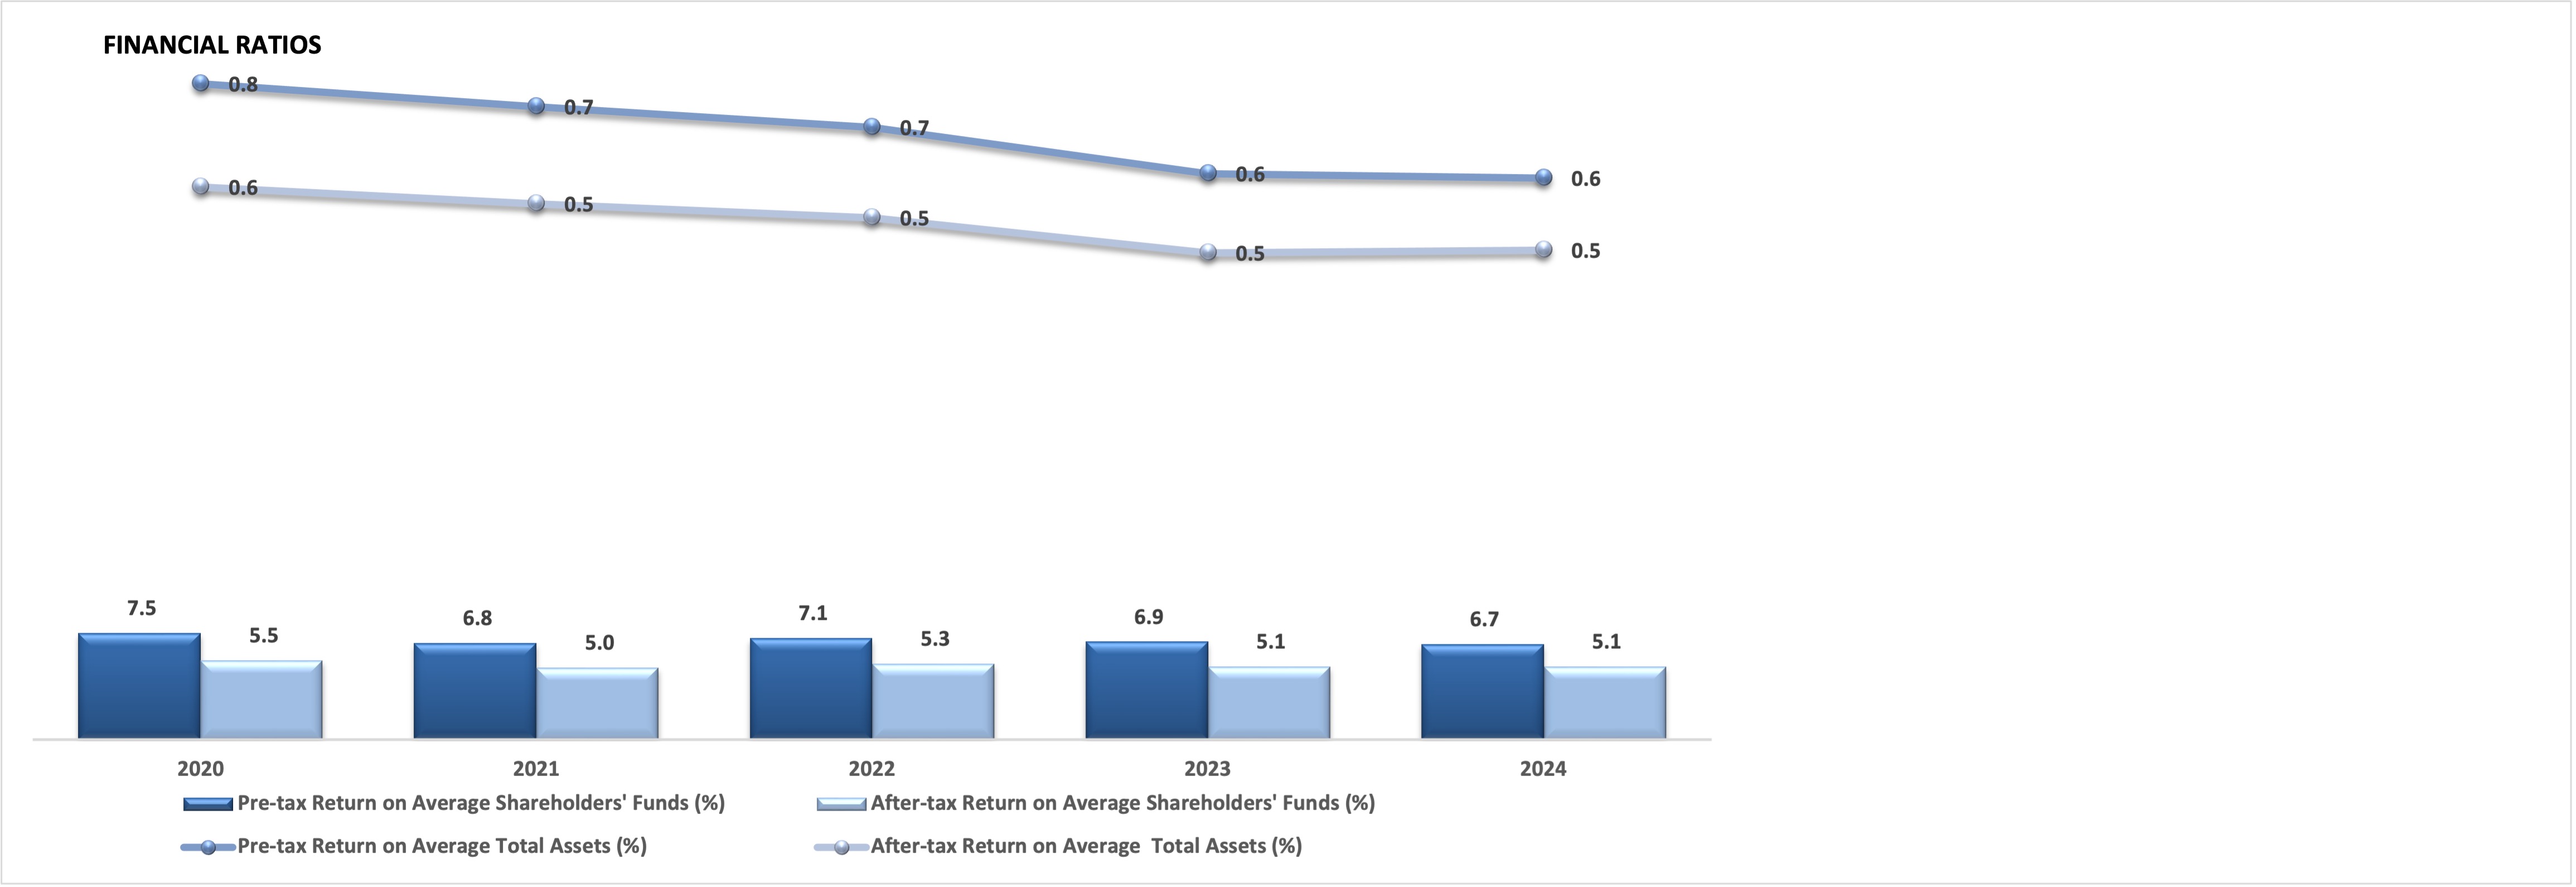
| Financial Ratios | ||||||
|---|---|---|---|---|---|---|
| Group | ||||||
| 2020 | 2021 | 2022 | 2023 | 2024 | ||
| Pre-tax Return on Average Shareholder's Funds (%) | 7.5 | 6.8 | 7.1 | 6.9 | 6.7 | |
| After-tax Return on Average Shareholder's Funds (%) | 5.5 | 5.0 | 5.3 | 5.1 | 5.1 | |
| Pre-tax Return on Average Total Assets (%) | 0.8 | 0.7 | 0.7 | 0.6 | 0.6 | |
| After-tax Return on Average Total Assets (%) | 0.6 | 0.5 | 0.5 | 0.5 | 0.5 | |
| Dividend Cover (times) | 7.5 | 1.6 | 7.5 | 7.5 | 7.9 | |
| Total Capital Ratio (%) | 45.3 | 42.4 | 38.0 | 32.0 | 38.4 | |
